

Heatmaps for WordPress come in two very different forms: a dedicated heatmap plugin that adds its own tracking script to every page, or a heatmap feature built into a broader analytics tool you're already running. The real distinction isn't price — it's whether the heatmap data lives next to your traffic numbers or in a separate dashboard, and whether the script it drops onto your theme is light enough to stay off your Core Web Vitals report.
TL;DR:
- Heatmaps show where visitors click, how far they scroll, and where their cursor idles — not what they think or why they left.
- Click maps, scroll maps, and move maps measure different things; using the wrong one for your question wastes the data.
- Most WordPress heatmap tools add a separate tracking script, meaning a separate script tag, a separate dashboard, and sometimes a second consent requirement.
- Aggregated heatmaps blend mobile and desktop visitors into one confusing image unless you filter by device first.
- Treat a heatmap as a hypothesis generator, not a verdict — pair it with session replays or real traffic numbers before you redesign anything.
Table of Contents
- What a WordPress Heatmap Actually Measures
- Plugin or Platform: The Two Ways to Add Heatmaps to WordPress
- What Heatmaps Miss, Even When the Colors Look Convincing
- The Consent Banner Question Most Heatmap Plugins Don't Mention
- The Performance Tax: What a Heatmap Script Costs Your Theme
- Three Questions to Ask Before You Install a Heatmap Tool
- Reading a Heatmap Without Overreacting to It
- See Clicks, Scrolls, and Traffic in the Same Screen
- Frequently Asked Questions
- Sources
What a WordPress Heatmap Actually Measures

A heatmap breaks what happens on a single page into three separate pictures, and treating them as one is the most common mistake people make when they first look at one. Each map type answers a different question, and none of them tells you what a visitor was thinking.
| Map type | What it tracks | Best question it answers |
|---|---|---|
| Click map | Every tap or click, overlaid as a colored dot or blob | Which button, image, or link actually gets touched? |
| Move map (attention map) | Cursor movement on desktop, used as a rough proxy for eye movement | Where does attention linger before someone clicks or leaves? |
| Scroll map | How far down the page each visitor gets, shown as a fading gradient | Does anyone see the content below the fold? |
The move map's accuracy as a stand-in for eye tracking is debated, and for good reason. Nielsen Norman Group's long-running eye-tracking research found that people scan web pages in an F-shaped pattern rather than reading evenly, which means cursor position and actual gaze often diverge, especially on text-heavy WordPress pages like blog posts or pricing tables.
Plugin or Platform: The Two Ways to Add Heatmaps to WordPress

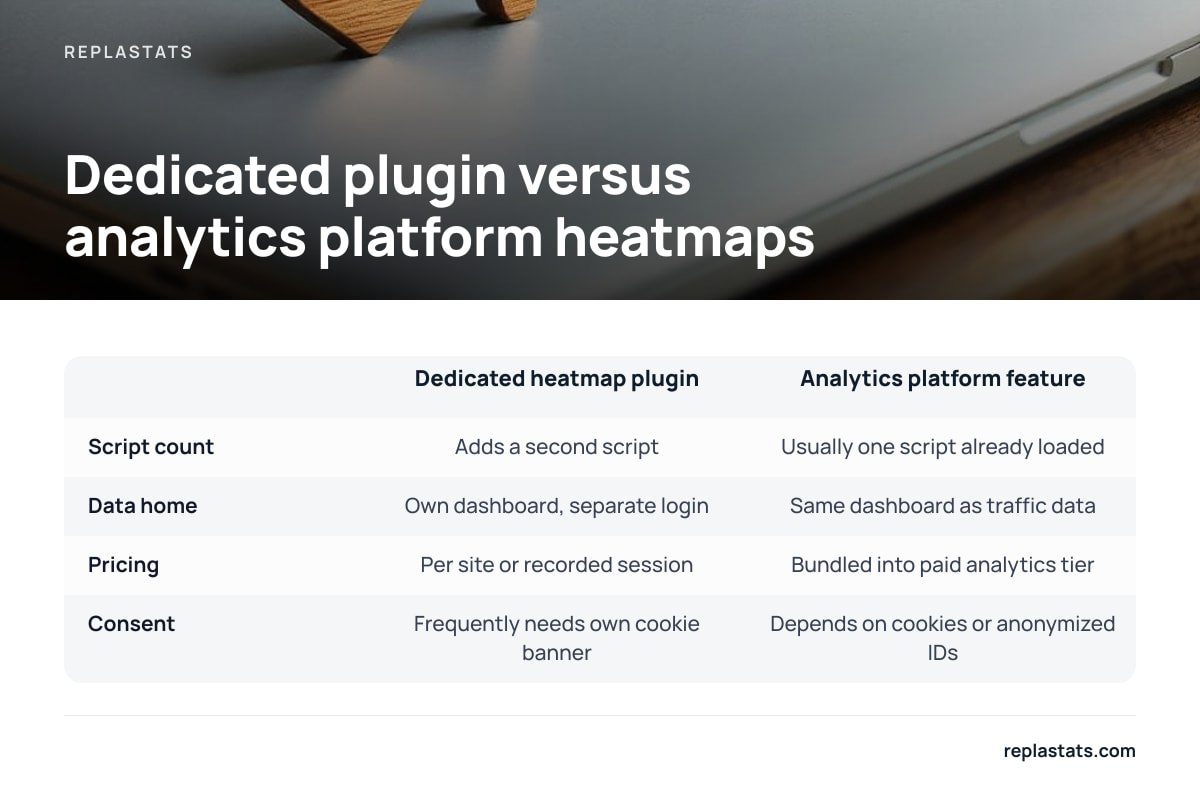
Every heatmap tool for WordPress falls into one of two camps, and the camp matters more than the feature list.
| Dedicated heatmap plugin | Heatmap feature inside an analytics platform | |
|---|---|---|
| Script count | Adds a second script alongside your analytics tool | Usually one script already loaded for traffic data |
| Data home | Its own dashboard, separate login | Same dashboard as visitors, sources, and top pages |
| Pricing | Often priced per site or per recorded session | Usually bundled into a paid analytics tier |
| Consent | Frequently needs its own cookie banner | Depends on whether it sets cookies or uses anonymized identifiers |
A dedicated plugin can be the stronger pick if heatmaps are the only thing you care about and you want granular controls. For most site owners, though, bolting a third-party heatmap plugin onto a WordPress install you're already trying to keep lean is exactly the kind of decision covered in WordPress Analytics Plugin: Pick One That Won't Bloat Your Site — another plugin, another settings page, another thing that can slow the admin down. If you've already been burned by a plugin that quietly filled your database with tracking tables, the comparison in Best WordPress Analytics Plugin Without Database Bloat is worth reading before you install anything new.
What Heatmaps Miss, Even When the Colors Look Convincing

A heatmap shows you where something happened. It never shows you why.
A bright red cluster on a click map could mean visitors love a button, or it could mean they're clicking a headline that looks clickable but isn't, out of habit or frustration. A thin scroll map past the fold could mean your content is boring, or it could mean the page answered the question in the first screen and nobody needed to keep going. The map can't tell the difference, and neither can you without more context.
A click map can tell you where a visitor tapped. It cannot tell you whether they meant to, or what they expected to happen next.
This is why heatmaps work best paired with session replays, which show the actual sequence of movement, hesitation, and backtracking rather than a flattened average across every visitor who touched the page that week.
The Consent Banner Question Most Heatmap Plugins Don't Mention
Heatmap and session recording tools almost always count as non-essential tracking, which has consent consequences that plugin marketing pages tend to skip over.
The UK's Information Commissioner's Office guidance on cookies and similar technologies is clear that analytics and behavioral tracking of this kind generally needs consent before it runs, under the UK's Privacy and Electronic Communications Regulations. Most heatmap and session replay tools set a cookie or use a fingerprinting method to recognize a return visitor, both of which fall outside the "strictly necessary" exemption. If a plugin's sales page doesn't mention a consent banner anywhere, that's a question to ask support directly rather than assume away.
The Performance Tax: What a Heatmap Script Costs Your Theme
Every heatmap tool runs a script, and every script adds to the weight your WordPress theme has to load before the page is usable.
2.5 seconds. That's the line Google's Core Web Vitals draws between a page that loads fast enough and one flagged for improvement, measured as Largest Contentful Paint.
Session recording scripts in particular tend to be heavier than a basic analytics tag, because they're capturing and buffering every mouse movement and scroll event in real time rather than firing once per page view. On a theme that's already carrying a page builder, several widgets, and a handful of marketing plugins, one more heavy script can be the difference between a passing Core Web Vitals score and a failing one.
Three Questions to Ask Before You Install a Heatmap Tool
- Does it add a second script, or does it piggyback on analytics you already run? Two scripts mean two things to audit if your site ever slows down or a security scan flags unfamiliar third-party requests.
- Does it store data in your WordPress database, or on a separate server? Session recordings and heatmap data accumulate fast, and a plugin writing that volume into your
wp_optionstable is a slow-motion bloat problem. - Can you filter by device before you draw conclusions? A heatmap that only shows an aggregate view, mixing phone taps with mouse clicks, will mislead you about what's actually happening on either one.
Reading a Heatmap Without Overreacting to It
The single biggest mistake is redesigning a page based on one heatmap from one week of traffic, especially if that week included a sale, a holiday, or a spike from a single referral source.
Pro Tip: Before you trust a heatmap pattern, check whether your WordPress theme serves a genuinely different layout on mobile rather than just a squeezed version of the desktop one. Many themes reorder sections, hide sidebar widgets, or collapse menus below a certain breakpoint, which means a single aggregated heatmap is secretly showing you two different pages layered on top of each other. Split the view by device first, and patterns that looked confusing usually resolve into two sensible, separate stories.
Once you've got the device-level view sorted, the next step is connecting what the heatmap shows to your actual traffic numbers — which pages are getting the views in the first place, and where that traffic came from. That's the broader discipline covered in How to Analyze Website Traffic Without Drowning in Dashboards, and it's the context that turns a colorful image into an actual decision.
See Clicks, Scrolls, and Traffic in the Same Screen
If you're running more than one WordPress site, the real headache usually isn't the heatmap itself — it's that your heatmap tool, your analytics tool, and your traffic numbers live in three different logins. Replastats keeps visitors, sources, top pages, and live traffic in one screen without a consent banner, and from the Starter plan up, it adds session replays and heatmaps right alongside that same traffic data instead of in a separate app. The WordPress plugin installs with a pre-connected setup and puts the reports inside wp-admin, so there's one place to check rather than two.
The honest caveat: heatmaps and replays are a paid-tier feature, not part of the free single-site plan, and if you're only ever going to run one site and never touch a heatmap, a lighter free tool might cover you fine. If you're running several sites across WordPress, Shopify, or Webflow and want the heatmap and the traffic numbers in the same place, check the plan page against what you actually need before upgrading — and if a cheaper option without those traps is the priority, Finding a Cheaper Alternative for Privacy Analytics Without Traps walks through that trade-off directly.
Frequently Asked Questions
Do heatmaps work on a WordPress page built with a page builder like Elementor or Divi?
Yes, heatmap tools track clicks and scroll depth on the rendered page, not the builder that created it, so they work regardless of which page builder a theme uses. The one thing to check is whether dynamic content that loads after the initial page render, like a lazy-loaded image carousel, gets captured correctly, since some older heatmap scripts snapshot the page too early.
Will a heatmap plugin slow down my WordPress site?
Any script adds some load time, and session recording scripts tend to be heavier than a simple click tracker because they buffer continuous movement data. Test your Largest Contentful Paint before and after installing, using a tool built around Google's Core Web Vitals thresholds, to see the actual impact rather than guessing.
Do I need a cookie consent banner to run heatmaps on WordPress?
In most cases, yes, because heatmap and session recording tools are generally classed as non-essential tracking under rules like the UK's PECR and similar consent laws elsewhere. Some cookieless analytics tools avoid this by not setting identifying cookies at all, which is worth checking before you assume a banner is unavoidable.
What's the difference between a heatmap and a session replay?
A heatmap aggregates behavior across many visitors into one composite image, showing patterns like where clicks cluster. A session replay shows one individual visitor's actual sequence of movements and clicks, which is far more useful for understanding why a specific drop-off or confusing moment happened.
Can I use a heatmap to measure conversion rate directly?
Not directly — a heatmap shows interaction patterns, not outcomes like completed purchases or form submissions. You'll still need your actual traffic and conversion numbers to know whether a change you make based on a heatmap insight actually moved the needle.
Sources
- F-Shaped Pattern for Reading Web Content | Nielsen Norman Group
- Guide to PECR: Cookies and Similar Technologies | UK Information Commissioner's Office
- Web Vitals | web.dev (Google)